

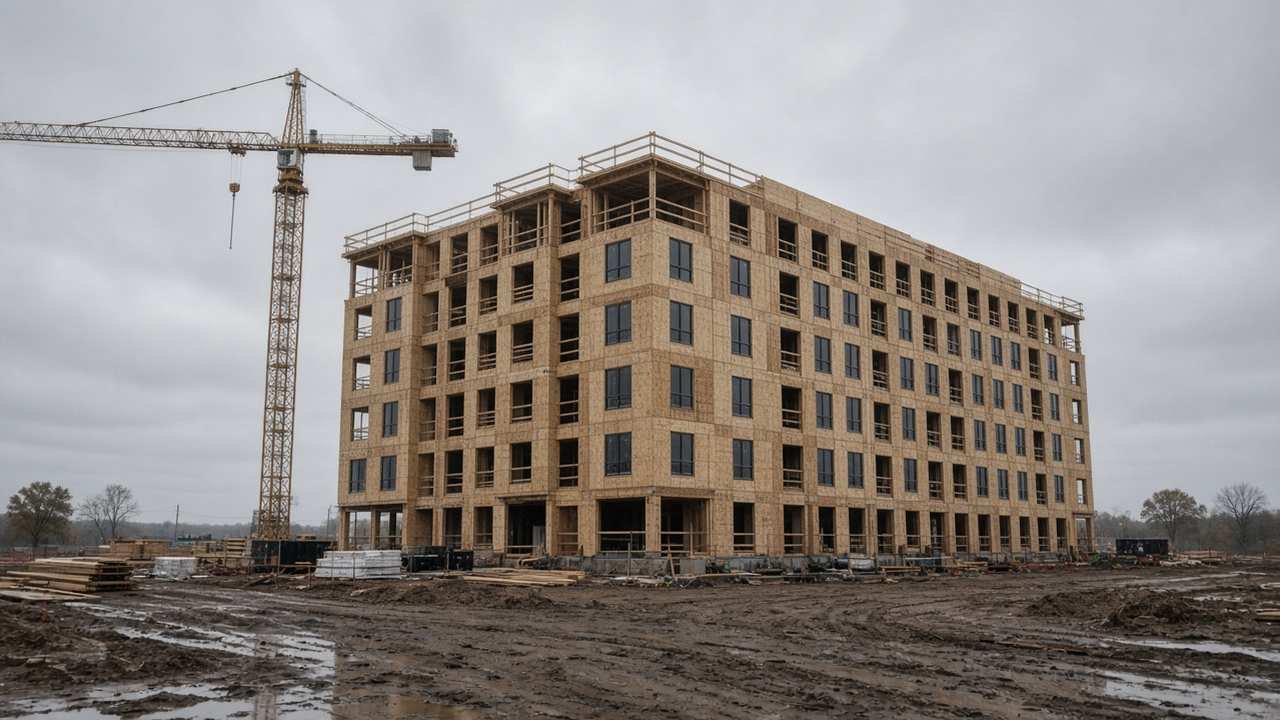
National multifamily completions in buildings with five or more apartments are cresting after a 2024 peak. Units still under construction, meaning started but not yet finished, sit roughly one-third below their 2023 high. That national crest is real.
A committee that treats it as permission to ease the rents in a Louisville model, or to take the free months out, is pricing a metro that did not have the same year.
If you are looking at a Midwest workforce deal (apartments aimed at working households, not a luxury tower) and someone asks whether you can soften the rents you underwrite, or the concessions you assume, because “supply is easing nationally,” that is where the price gets ahead of the building. A concession here means free rent or another discount given to get a lease signed. We at Heartland Gate treat the national series as a sign that new supply is cooling in the country as a whole, not as permission to ease underwriting across the Midwest metros we keep under a working research focus: Northwest Indiana (Lake and Porter counties), Milwaukee, Evansville, Louisville (Kentucky-Indiana), and St. Louis (Missouri first). Those metros do not share one supply cycle. Keep near-term rents conservative, and leave room for concessions, until two things are true on the same broker’s numbers: vacancy in the mid- or low-single digits, and forward deliveries that look light relative to the apartments already standing.
Do not underwrite rent or concession relief from a national headline alone.
This piece sits beside our market-selection framework essay, The Heartland Gate Market-Selection Framework. Supply pipeline is already one scored factor there (10%). Here we show how to read public delivery and pipeline evidence for these Midwest metros, without calling any of them a market we have cleared to buy, immune to too much new supply, or “selected.”
The national picture: cresting, not climbing
The Census Bureau and the Department of Housing and Urban Development count apartments completed in buildings with five or more units. The St. Louis Fed republishes that count on Federal Reserve Economic Data (FRED) under the series code COMPU5MUSA. The figures are a seasonally adjusted annual rate (SAAR): the month’s pace, restated as if that pace held for a full year, so one month can be compared with another. The calendar-year monthly average peaked near 590,000 in 2024, then fell to about 471,000 in 2025 and about 417,000 averaged through August 2026. The August 2026 monthly print sits at 302,000 SAAR. The series is past its peak. It is not still climbing.
Units under construction in the same five-or-more universe are on FRED as UNDCON5MUSA. That series peaked in July 2023 at 1,001,000 SAAR and printed 666,000 in August 2026, roughly a one-third decline from the peak. The stock of apartments already in the ground is past its peak too.
The National Association of Home Builders (NAHB), in its July 2026 reading of the Census Survey of Construction, puts 2025 U.S. multifamily completions at 484,000, with the Midwest at 63,000 (13%). Builders and lenders can slow down nationally while a Midwest metro is still taking delivery of buildings that were started a year or two earlier. Those 63,000 Midwest completions do not tell you whether Louisville can push rents, or whether the region is protected from too much new supply.
Starts usually turn down before completions do. A building permitted this year may not finish for 12 to 24 months, so a drop in national starts does not stop the apartments already underway from arriving. The national crest is a reason to stop treating every Midwest market as if a flood of new units were still accelerating. It is not evidence that any one of these metros has cleared its own pipeline.
Permits, starts, under construction, completions: keep the lag
Mixing these five is how “supply is cresting” turns into false comfort.
- Building permits authorize construction. The Census Building Permits Survey (BPS) counts permits local governments issue. Its “5 units or more” series leads deliveries. It is not the same set of buildings a broker counts as finished apartments.
- Housing starts are buildings where construction has begun. They still lead the day a tenant can move in.
- Under construction is the stock of units already started and not yet finished. It falls when completions outrun new starts. Broker reports often shorten this to UC.
- Completions, also called deliveries, are units that finish and join the rent roll. On multifamily, the lag from permit or start to delivery is often 12 to 24 months or more.
- Absorption is how many apartments tenants actually took over a period, net of move-outs. Completions that tenants do not take show up as empty units and as concessions.
When a broker says “supply is easing,” ask which of those five they mean, for which metro or neighborhood, and for which months.
Midwest working-focus metros are not one supply cycle
We name these metros only as a working research focus we are still studying. They are not markets we have cleared to buy, not Heartland Gate targets, and not a ranked “best Midwest” list. Our market-selection scorecard already weights the new-supply pipeline at 10%. This article does not rebuild that framework. Averaging these metros into one Midwest supply story would put the wrong rent in the model.
Census BPS units authorized in structures with five or more units, from the annual files for each Core Based Statistical Area (CBSA, the Census boundary for the metro) for 2022 through 2025, and from the monthly files through August 2026, show the split. A permit is not next year’s delivery.
| Metro (CBSA label) | 2022 | 2023 | 2024 | 2025 | Reading on permits, then future deliveries |
|---|---|---|---|---|---|
| Louisville-Jefferson County, KY-IN | 1,951 | 3,672 | 1,894 | 2,436 | 2023 peak; 2025 still elevated vs 2022 (1,951) |
| Milwaukee-Waukesha, WI | 1,249 | 1,154 | 2,016 | 1,132 | 2024 spike; 2025 cooler |
| St. Louis, MO-IL | 4,202 | 2,282 | 2,017 | 1,523 | Annual permits down 2022 to 2025; 2026 year-to-date pace re-accelerating (watch the lag into 2027-28) |
Louisville’s permit peak was 2023, and 2025 is still above 2022. Milwaukee spiked in 2024 and cooled in 2025. St. Louis permits fell from 2022 through 2025, and the 2026 year-to-date pace has picked back up. Averaging those three would hide which underwriting year actually receives the new units. Broker delivery and occupancy prints push the rule further apart. We cite each firm as that firm’s count. We do not treat a paid broker extract as a Census fact, and we do not blend two firms into one vacancy rate.
Louisville: still not a clean "ease up" print
Start with under construction as a share of the apartments already standing, not with the national headline. MMG Real Estate Advisors (MMG), in its public 2026 Louisville forecast and its second-quarter 2026 market report, describes a market that has not clearly crested on competitive supply. By the second quarter of 2026, under construction still sat around 3,400 units, or about 3.5% of inventory. Completions over the trailing four quarters roughly matched absorption. Occupancy printed about 92.3%, down roughly 110 basis points from a year earlier. A basis point is one one-hundredth of a percentage point, so 110 basis points is 1.10 percentage points. Forecast 2026 completions stay near the long-run average rather than collapsing. Southern Indiana projects remain active on public pipeline lists.
With under construction still high relative to inventory, and occupancy soft on that firm’s print, Louisville is not where we cut concession assumptions because “national supply crested.” Keep the near-term rent case conservative, allow for a slower fill-up of new buildings, and leave concession room in the revenue line.
St. Louis: deliveries cooling, vacancy not yet recovered
The national pattern shows up more clearly here, and it is still not enough to ease the rent case. Northmarq’s March 2026 supply note puts 2025 St. Louis deliveries near 2,400 units, down about 13% from the year before and roughly half the 2022 peak, with 2026 among the slower construction years of the past decade. MMG’s public figures sit in the same range: 2025 completions about 2,360, a 2026 forecast nearer 1,400, and under construction around 2% of inventory early in 2026. Occupancy is still soft. MMG prints near 90% occupancy, and Newmark prints about 10.8% vacancy in the first quarter of 2026. Those are two firms counting differently. We do not average them into one St. Louis vacancy. Fewer deliveries are a condition for rents to recover. They are not, by themselves, the recovery, while vacancy on the same firm’s series is still soft.
Fewer new apartments are finishing, and vacancy on the cited prints is still soft. A thinner delivery year does not put pricing power back in the rent roll on its own. Do not ease the rent and concession base case yet. Watch vacancy on one firm’s series recover first.
Milwaukee: closest public print to selective ease (still under investigation)
Milwaukee is the contrast, not a clearance to buy. Northmarq’s first-quarter 2026 Midwest commentary forecast roughly 900 units completing in 2026, with vacancy around 4.2%. Public 2026 completion forecasts still disagree (Northmarq near 900, MMG’s 2026 forecast near 1,348), so we do not lock a single number. MMG’s second-quarter 2026 public report shows trailing-four-quarter absorption well ahead of completions, and occupancy near 96%. The rule still turns on vacancy from one firm and on forward deliveries that are light relative to inventory, not on one broker’s completion count. Both prints step 2025 completions down into 2026.
Among the metros in this working set, Milwaukee is the closest public case for offering fewer concessions later, if the neighborhood’s lease-up holds and vacancy on that same firm’s series holds. A submarket is the neighborhood inside the metro; verify that, not just the metro average. Do not copy Milwaukee’s print onto Louisville or St. Louis. Do not move any of these metros from “still studying” to “cleared to buy” on supply alone.
Evansville, briefly: the Kirkland Company’s second-quarter 2026 report shows chronically thin deliveries and under construction near 1% of inventory. The caution there is whether there is enough tenant demand and whether a buyer can sell later, not whether too many buildings are going up. Northwest Indiana (Lake and Porter counties) has no public series for multifamily units under construction. Permits for the Chicago metro are not a stand-in. Stay cautious there until that gap closes.
What could challenge this reading
- The national series turns back up. If the FRED five-or-more completions series (COMPU5MUSA) and the under-construction series (UNDCON5MUSA) rise for two or more months in a row, the cresting backdrop weakens.
- Louisville’s under-construction share falls hard while vacancy firms on the same firm’s series. Selective ease becomes easier to defend there than it is today.
- St. Louis vacancy recovers on one firm’s series while 2026 deliveries stay light. Cooling supply would then be showing up in the same year as stronger rents.
- St. Louis building permits in 2026, year to date, keep re-accelerating and feed a start wave that shows up as completions in 2027 and 2028. Light 2026 deliveries and hotter 2026 permits can both be true. The lag decides which underwriting year gets the new units.
- Milwaukee absorption cools, or a new wave of permits and starts reloads units under construction. The “closest to ease” case would narrow quickly.
None of those changes today’s working rule. These Midwest metros are not one supply cycle, and the rent case stays cautious until the local evidence says otherwise.
What this means for underwriting
Heartland Gate’s working rule from this evidence:
Keep near-term rents and concessions conservative at the property and at the neighborhood, especially where vacancy is already soft or under construction is high relative to the apartments already standing. Treat national cooling, and cooling in a metro that has actually cooled, as a sign that relief may be coming. Do not treat it as clearance to ease the model today.
What an investor or a buyer should refuse to assume:
- That a national completions crest clears the path for a new building in this metro to fill.
- That “supply is easing” means the same thing in Louisville, St. Louis, and Milwaukee.
- That fewer deliveries restore rent power while vacancy on the same firm’s series stays soft.
- That Midwest workforce housing is protected from too much new supply.
- That rents recover in the base case only because national completions peaked in 2024.
Questions worth asking before softening assumptions:
- Which count did the broker mean: permits, starts, units under construction, completions, or absorption?
- For which metro or neighborhood, and for which months?
- What share of existing apartments is under construction, on one firm’s series?
- Where does vacancy or occupancy sit on that same series, and is it improving?
- Are the apartments still to be delivered light relative to the stock already standing, or still competitive with it?
Ease the underwriting only where vacancy on one firm’s series is in the mid- or low-single digits and the apartments still to be delivered are light relative to the stock already standing. Do not copy that ease across the whole working set.
A crest in supply can support fewer concessions later. Soft vacancy, with apartments still under construction, means that later is not this year’s model.
Our scorecard already says we do not buy on a market score alone. This note is about how we read one 10% factor, new supply, when the national numbers look friendlier than the metro’s.
What to watch
- Monthly FRED prints for COMPU5MUSA and UNDCON5MUSA. A sustained turn back up would weaken the national crest reading.
- Census BPS permits for five-or-more-unit buildings in the Louisville, Milwaukee, and St. Louis CBSAs, and whether St. Louis’s 2026 year-to-date re-acceleration holds. That is a lead on 2027 and 2028 completions, not a claim that 2026 deliveries are still climbing.
- One firm’s metro series for under construction as a share of inventory, and for vacancy or occupancy, in Louisville and St. Louis (MMG, Northmarq, or a peer; one firm at a time).
- Broker forecasts of 2026 and 2027 completions against trailing absorption in Milwaukee.
- A local planning count, or a Bob-authorized extract, for multifamily units under construction in Lake and Porter counties. Until that gap closes, Northwest Indiana stays cautious on supply.
The national crest is real. The concession line is still written in the metro tape.
Louisville still argues for a conservative rent case. St. Louis shows fewer deliveries without a vacancy reading that would support higher rents. Milwaukee is the closest public print to easing concessions later, among the metros we are studying, and even there we check the neighborhood before we change the model.
Do not underwrite rent or concession relief from a national headline alone.
We will keep teaching that distinction in Operating Notes as fresh permit months and broker quarters land.
Sources
- FRED: New Privately-Owned Housing Units Completed: Units in Buildings with 5 Units or More (COMPU5MUSA)
- FRED: New Privately-Owned Housing Units Under Construction: Units in Buildings with 5 Units or More (UNDCON5MUSA)
- Census Building Permits Survey: CBSA annual files
- NAHB: Multifamily High-Density Completion Trends 2025
- Northmarq: New Supply Growth Continues to Ease in St. Louis Multifamily Market
- MMG: 2026 Louisville Forecast
- MMG: Louisville Q2 2026 Market Report
- MMG: Milwaukee Q2 2026 Market Report
- The Kirkland Company: Evansville Multifamily Market Report (June 2026)
By Bob Ewoldt · Last reviewed September 29, 2026
Educational content only. Not an offer to sell or a solicitation to buy securities. Past data and broker prints are not projections of future results. Heartland Gate does not declare these Midwest working-focus metros as markets cleared to buy in this article.
Leave a Reply